Monitoring overview
This page is for system administrators who build monitoring for Exponential sites, and for support staff who need to know where to look first. It answers: which signals Exponential gives, which of them a monitoring system can read (exit codes, JSON, HTTP endpoints), and which belong to a human looking at a page once a week.
"There is no single health URL; combine a check from outside with the status commands inside" (10.11 Monitoring and health checks). The external checks are on Health checks and uptime.
Contents
- Four layers of monitoring
- Status commands for a monitoring system
- Pages for a human
- Velocity's own endpoints
- Alerts the site sends itself
- Monitoring many customer sites
- Checklist
Four layers of monitoring
| Layer | Question | Exponential's tools |
|---|---|---|
| Reachability | Does the site answer, fast enough? | an HTTP check from outside; Velocity's /Q/health |
| Platform | Is PHP, OPcache, the database, the disk, cron in order? | exp:systeminfo, exp:cache status, crontab:list |
| Application | Are there new errors, attacks, failed jobs, mail problems? | the logs, the error digest, exp:mail:status, exp:notificationstatus |
| Integrity | Has anyone changed what they should not? | the audit trail and exp:audit verify |
Status commands for a monitoring system
All of these run from the installation root as the site's user. Most have --json for a machine and end with a
recognizable status or an exit code.
| Check | Command | Healthy |
|---|---|---|
| Health checks of the platform | ./console exp:systeminfo --json | exit status 0; it "exits 1 when a check fails" |
| Caches | php bin/php/cache.php status --json --allow-root-user | ends in PASS |
| Velocity | php bin/php/console exp:velocity status --json --allow-root-user | running, workers as configured |
| Notifications | php bin/php/console exp:notificationstatus | no events waiting without a recent run |
| Audit trail | php bin/php/audit.php verify --allow-root-user | exit status 0 (1 means a chain is broken) |
| E-mail preferences | ./console exp:mail:status | five tables ok, no problems listed |
| Cron | php bin/php/console crontab:list and the dates of the cron logs | entries present, logs recent |
| Disk | df -h /path/to/installation | room for caches, logs and a backup |
| Performance | php bin/php/console exp:benchmark --baseline=var/benchmark/base.json | exit status 0 (no regression) |
| Database | SQLite: Monitoring a SQLite site; Oracle: ext:ezoracle:health |
Sources: 10.11, System information, E-mail preferences, Benchmark.
"A small script in the site user's crontab that runs these and mails on a non-zero exit status is enough for a single server." For many servers, run the same commands from your monitoring agent and collect the exit codes.
Note
exp:systeminfo on the command line reports the command-line PHP, not the PHP-FPM pool or Velocity that serves the
site. The administration page Setup > System information shows the server that answered the request; open it
through each server you run (System information, which server answered).
Pages for a human
| Page | What it shows | Who may open it |
|---|---|---|
Setup > System information (/setup/info) | which server answered, health checks with what to do, versions, OPcache, database, storage, cron, mail | setup/system_info |
Setup > Log files > Log health (/setup/logshealth) | disk used by logs against a budget, fastest growing logs, files the web server cannot write, newest error of each log | setup/logs |
Setup > Log files > Error digest (/setup/logsdigest) | the distinct errors and warnings of the last 24 hours, grouped and counted | setup/logs |
Audit tab (/audit/dashboard) | the chain state of each channel, recent events, alerts | audit/read |
| Setup > Cronjobs | parts, schedules, last runs, parts that need attention | setup/managecronjobs |
| Setup > E-mail preferences | mail gate state, problems, numbers | mailpreferences/administrate |
Log health warns from 80 % of logviewer.ini [HealthSettings] DiskBudget (shipped 256 MB) and flags logs with mixed
owners, which stop rotation (Log health). See
Log viewer and rotation.
Tip
A weekly look at the error digest and security.log is in the project's own checklist: "a sudden rise of one rule
is worth a look" (Security hardening).
Velocity's own endpoints
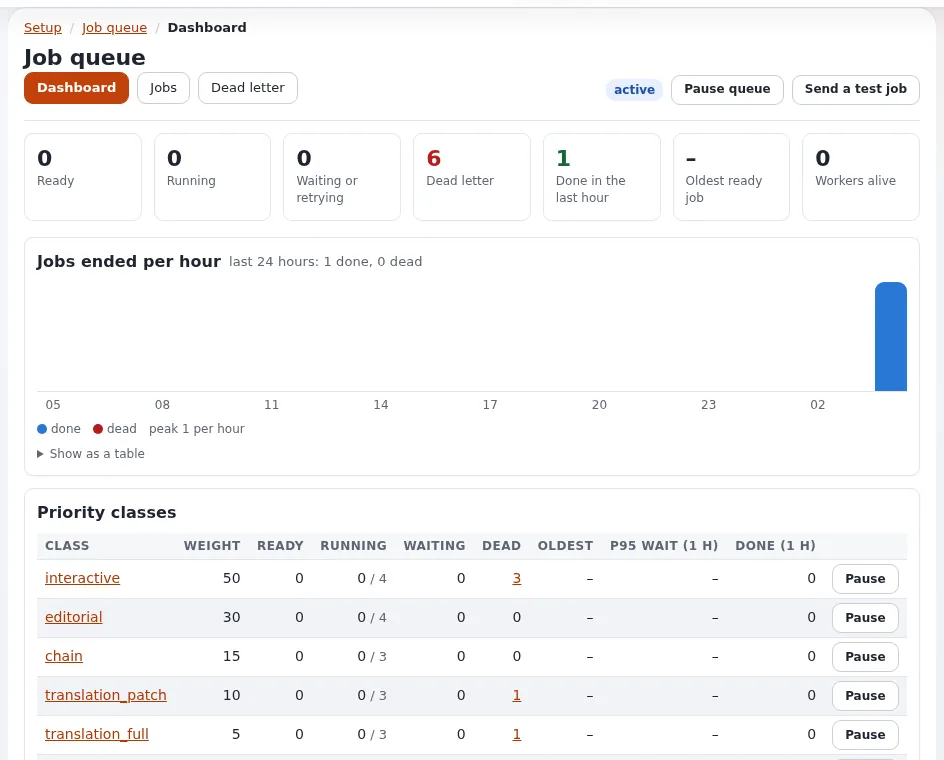
When a site is served by Exponential Velocity, the server has views of its own (Velocity control panel):
| Endpoint | Format | Use |
|---|---|---|
/Q/health | JSON, for monitors | answers anyone with {"status":"ok"}; figures only for an admin |
/Q/metrics | Prometheus text | scraping into a metrics system |
/Q/stats | JSON, the full payload | dashboards such as Grafana |
/Q/dashboard | HTML | a human view of workers, memory and traffic |
Who may open them is set in settings/velocity.ini [DashboardSettings]: by default only from the same machine;
Token= sets a secret that opens them remotely (?token=... or an Authorization: Bearer header); Remote=enabled
opens them without a token, "only for a port that a firewall already restricts to trusted addresses".
The Velocity watchdog (exp:velocity watchdog install, a systemd timer) starts the default engine again when it is
down and nobody meant it to be, and logs what it did to var/log/velocity-watchdog.log
(The watchdog). It never touches a server that
runs; a server that runs but does not answer is for your monitoring to catch.
Alerts the site sends itself
The audit trail evaluates alert rules in the audit cronjob part (part of frequent): brute-force sign-ins, an
administrator role being granted, settings written out of hours, mass deletes, the audit being switched off and a
broken chain (The audit trail). Alerts go to a rule's recipients, else the
configured ones, else the site's AdminEmail:
./console exp:audit alerts recipients --allow-root-userOn a hosted site, decide whether alerts go to the customer, to your support team, or both, and make sure the
frequent part runs (Cron jobs). Sinks forward the trail to syslog or a webhook for a central system
(Security log).
Monitoring many customer sites
- Same commands everywhere. Every installation has the commands above; run them per installation directory, as that installation's user.
- Exit codes, not text. Parse the exit status and the JSON; the human text can change between releases.
- One external check per site address, plus one per node or engine port where you run several (Apache and Velocity on different ports show different figures).
- Keep thresholds per plan. Response time and disk use differ by customer; record a baseline per site
(
exp:benchmark --save) after go-live and compare against it.
Checklist
- To do: An external HTTP check covers the site and the administration login page.
- To do:
exp:systeminfo, cache status, audit verify and the disk are checked on a schedule by exit code. - To do: Cron logs are recent and
crontab:listshows the expected lines. - To do: Velocity's dashboard views are local-only or protected by a token.
- To do: Audit alert recipients are agreed with the customer.
- To do: Someone reads the error digest and
security.logweekly.
Related pages
- Health checks and uptime
- Log viewer and rotation
- Request logs, Security log
- Benchmarking a hosted site
- Slow site, Site down (runbooks)
- Free documentation: this page is free to copy, translate and improve under the GNU FDL 1.3.
Become an Exponential Partner
Partners share their information, provide funding, contribute back and develop the products with us, and that is how Exponential grows. A partner website and dashboard are planned for mid-2027: please become a partner today to speed up our growth rate and land new features faster.